Monitoring
All four monitoring windows open from the command palette, and on macOS from the native Query menu. Each one opens at most a single live instance; asking again focuses the window you already have.
Server activity
Ctrl+Shift+M
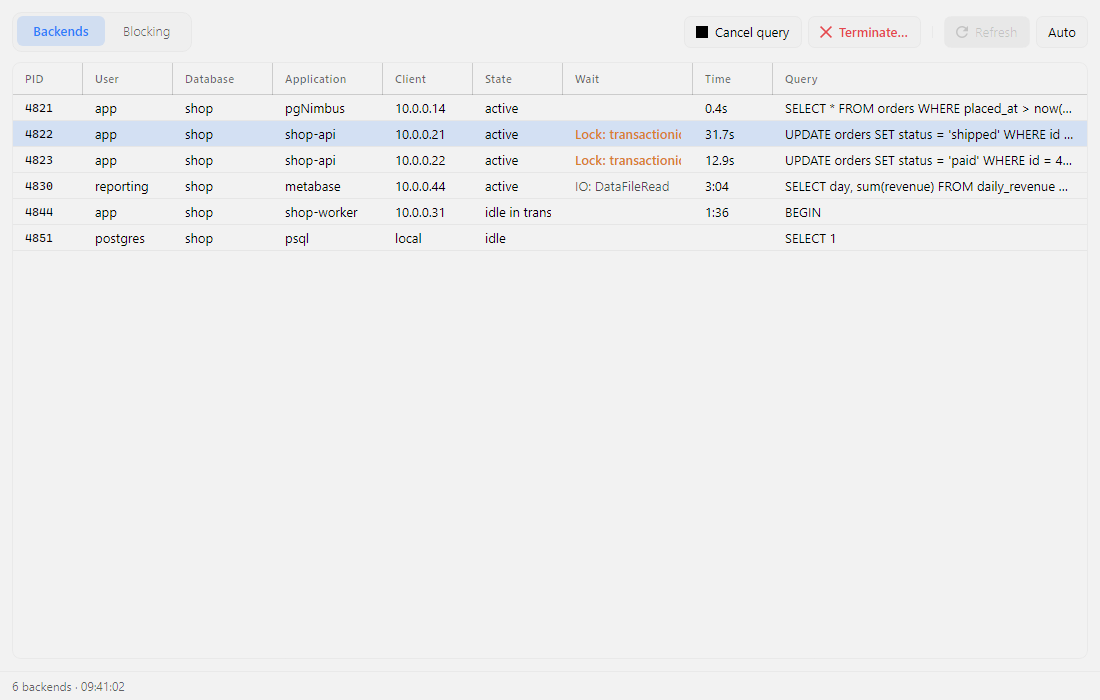
Two tabs, both refreshing every two seconds.
Backends
A live pg_stat_activity grid: who is connected, what they are running, how long
they have been at it, and what they are waiting on. Each backend can be cancelled
(stop the current statement) or terminated (drop the session) from the toolbar,
so a runaway query is one click away from stopping.
Blocking
The tab worth knowing about before you need it: a who-blocks-whom lock tree. Lock holders sit at the top, waiters nest underneath them, each labelled with the lock it is stuck on.
It is built on pg_blocking_pids() rather than a hand-rolled pg_locks
self-join, which matters. That function understands lock groups and parallel
workers, so it gets the answer right in cases a join gets wrong. The tree copes
with chains, waiters blocked by several backends at once, blockers that are not
visible in the snapshot, and momentary deadlock cycles.
Nodes auto-expand, so the whole wait chain is visible at a glance and stays that way across refreshes.
Aim at the root
Cancel and terminate on this tab act on the selected node. Aim at the holder at the top of a chain. Releasing it frees everyone nested beneath it, where killing a waiter achieves nothing.
Database overview
Ctrl+Shift+G
A read-only health panel over the pg_stat_* and pg_statio_* views:
- database size, and the largest relations, split into heap and index
- cache hit ratios, showing how much of your working set is actually in the buffer cache
- sequential versus index scan counts per table, with missing-index suspects flagged
- unused indexes that are not backing a constraint, with the disk they are wasting
Slow queries
Command palette: Slow queries (pg_stat_statements)
The statements that cost this database the most time, read from
pg_stat_statements.
Each row is one normalized statement, with its constants replaced by $1,
$2 and so on, and shows its calls, total and mean time, its share of all the
time, rows, and buffer cache hit ratio. Rank by Total time to see where
the server's time went, Mean for the slowest single calls, or Calls
for the chattiest statements.
Two scopes:
- Since reset counts everything since the statistics were last reset.
- Since time counts only what ran after the window opened. To measure one piece of work, press Restart interval, run the workload, then Refresh. This never resets the server's counters, so nobody else's numbers change.
If an entry was reset or evicted during the interval, its row is marked ↺, and the status line says so. A reset of the whole view is reported the same way, and the numbers then count from that reset.
Double-click a statement to open it in a new tab. It doesn't run. The tab
starts with a comment that says where the statement came from, and its $1
placeholders are still there: put real values back before you run it, or wrap
it in EXPLAIN.
pg_stat_statements has to be switched on by a superuser. It must be in
shared_preload_libraries, which needs a server restart, and it must be
created in the database with CREATE EXTENSION pg_stat_statements. If either
step is missing, the window says which one and offers the steps as a script to
review in a new tab. pgNimbus never runs them for you. Without
pg_read_all_stats, other roles' statements are hidden, and the status line
counts them.
LISTEN / NOTIFY monitor
Ctrl+Shift+L
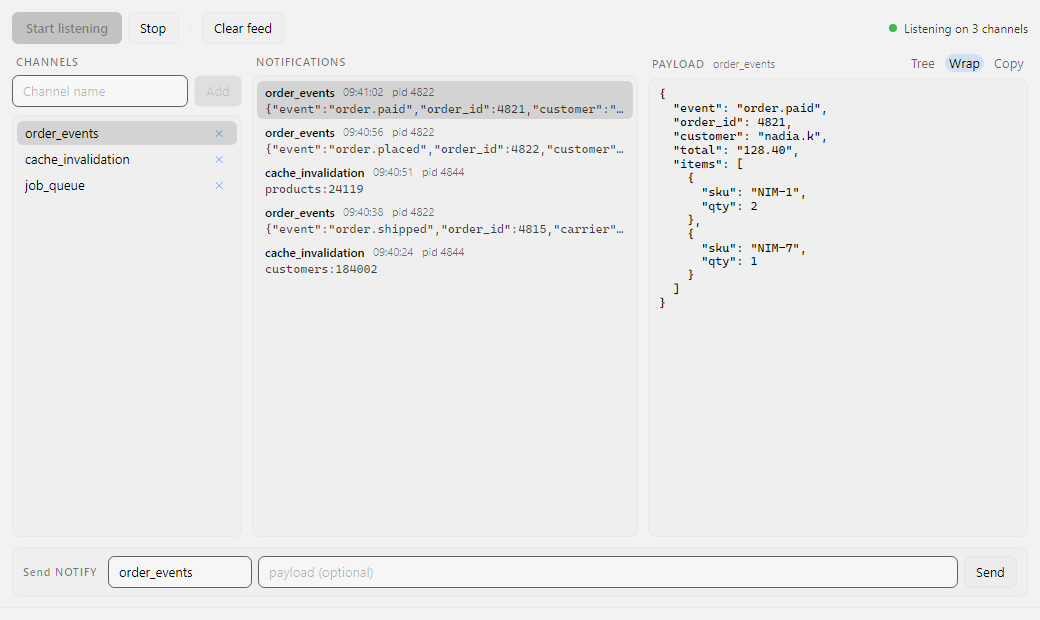
Watch an application's event plumbing without writing a consumer. Add the
channels you care about, press Start listening, and every NOTIFY on them
arrives in the feed.
- Payloads read as documents. Select a notification and its payload opens in
the pane on the right. JSON is formatted, and the Tree toggle browses it as
a collapsible document, the same view the results grid uses for a
jsonbcell. - Channels are remembered. The list is saved per connection, so the monitor opens next time with your channels already in it. It does not start listening on its own; that stays one click.
- Send a notification from here. The send box at the bottom publishes with
pg_notify(), so you can prove a channel works without opening a second session somewhere else. - A dropped connection comes back. If the connection behind the listener dies, the monitor re-establishes it and re-subscribes to every channel. If it cannot, it says so and stops showing itself as listening. Notifications published while the connection was down are gone, because Postgres keeps no backlog for a listener that is not connected.
The feed keeps the most recent 500 notifications.
Relation sizes in the schema tree
A dimmed size hint next to each relation in the schema tree. It is off by default; turn on "Show relation sizes" in Settings, under Appearance.
Views and partitioned parents show no size, because they have no storage of their own worth reporting.