Query plans
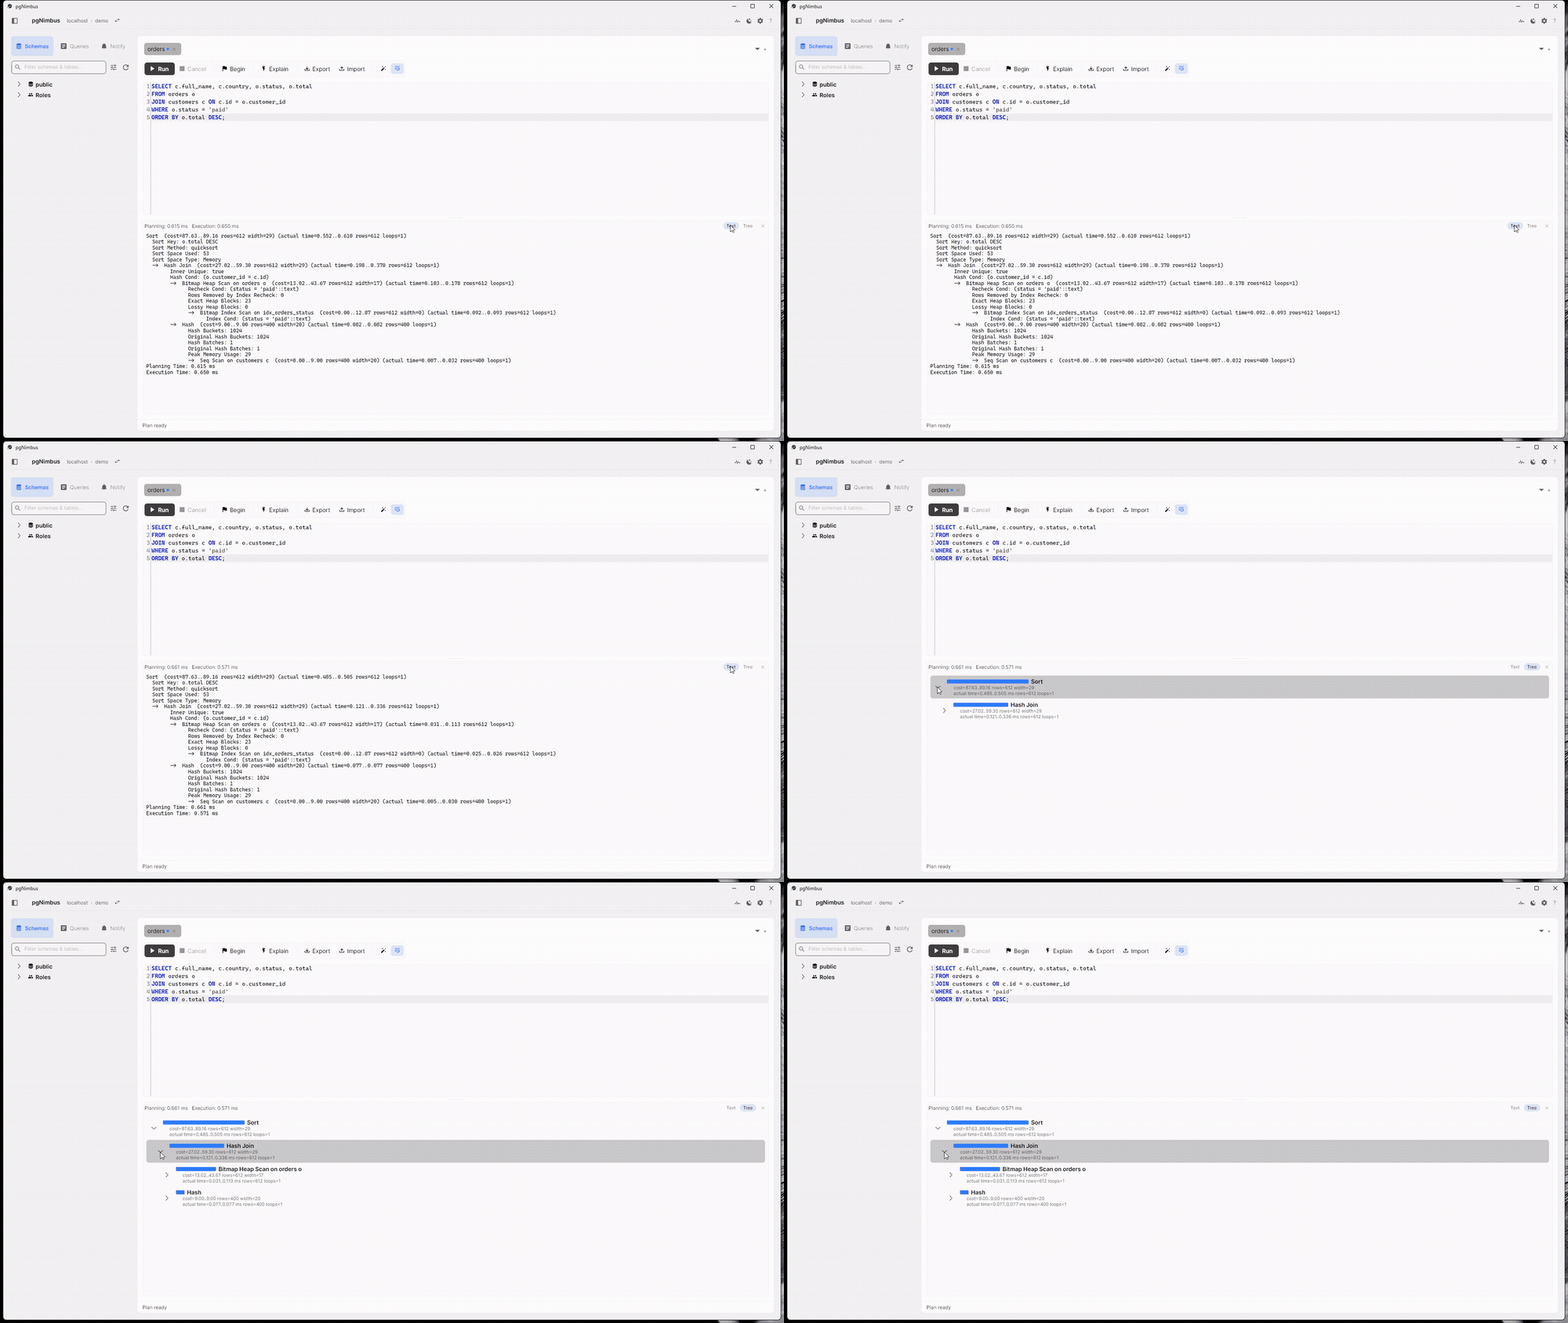
pgNimbus does not dump EXPLAIN output at you. It parses the plan, walks it for
known problems, and draws it as a tree with a time heat map.
Running EXPLAIN
| Action | Shortcut |
|---|---|
| Explain, the estimated plan, does not run the query | Ctrl+E |
| Explain Analyze, which actually runs the query | Ctrl+Shift+E |
Both are also on the toolbar's Explain button and in the command palette.
Analyzing a write is safe
EXPLAIN ANALYZE really executes the statement, which normally makes it
dangerous on an INSERT, UPDATE, DELETE, MERGE, or a data-modifying
CTE. pgNimbus runs every analyze inside a transaction it then rolls back, so
nothing persists. When the statement was data-modifying, the warnings strip
says so explicitly rather than leaving you to trust it.
The analyze path always requests BUFFERS and SETTINGS. Buffer counts are what
the spill and lossy-bitmap analysis reads, and they are the most useful thing
missing from a bare plan.
The tree
Each node's bar is sized by its exclusive self time, the time spent in that node
without counting its children, so the bar lengths point at where the query
actually spent itself rather than at whatever sits near the root. The single
slowest node is tinted as the bottleneck. Without ANALYZE timings the bars fall
back to cost.
Re-colour by metric. The header has a segmented Colour toggle, offering Time, Rows, Cost and Buffers, that rescales the bars in place and re-marks the hottest node. Switching to Buffers is how you find the node doing the I/O when the slow one is merely waiting on it.
There is a Text view alongside the tree, formatted the way
EXPLAIN (FORMAT TEXT) would: per-pool block counters folded onto one Buffers:
line, an I/O Timings: line, and zero-valued counters dropped so the output stays
readable.
Warnings
Above the plan sits a strip of plain-language warnings, each with something actionable to do about it:
- row estimates that are badly wrong, the usual root cause of a bad plan choice
- sorts and hashes that spilled to disk, often a
work_memconversation - sequential scans that are doing more work than they should
- lossy bitmap heap blocks, meaning the bitmap outgrew
work_memand Postgres fell back to re-checking whole pages
Each check uses a conservative threshold, so the strip stays quiet on healthy plans and means something when it is not.
Pasting a plan from somewhere else
"Import query plan…" in the command palette takes a plan from your clipboard, with no database round-trip and no connection needed to the server it came from. It opens in a new tab with the same tree, heat map and warnings as a live plan.
It auto-detects the format and is tolerant of what other tools emit. For
FORMAT JSON that means the [{ "Plan": … }] array, a lone { "Plan": … }
object, or a bare { "Node Type": … } node. FORMAT TEXT is parsed best-effort,
and psql's framing is stripped for you.
This is the way to look at a plan a colleague pasted into a ticket, or one pulled off a production server you cannot reach from your laptop.
Sharing a plan back out
The plan header's Export menu copies or saves the plan as JSON or as rendered text. The JSON is the raw server output, so it round-trips into any other plan tool. A plan you imported from text has no JSON to export, so those actions are hidden.