
A fast, open-source Kubernetes desktop client
It opens on the workloads that need attention and says why in one line, read from the cluster's own status. A native app with no telemetry, no account and no in-cluster agent. Built with .NET 10 and Avalonia 12, compiled ahead of time. MIT licensed.
or winget install --id 9MZ3C28M65PB --source msstore

Real views, rendered by the repository's own screenshot harness over the built-in demo cluster's sample data.
Before you install
Four things to know up front, so none of them is a surprise later.
-
It is new
1.0 shipped on 26 October 2026, and few people have run it against real clusters yet. Windows has had the most hands-on use. The macOS and Linux builds are launched by CI on their own platforms before each release, but have seen much less real use.
If something breaks, or works, please say so in an issue or in Discussions.
-
Windows: Store or winget only
The Microsoft Store is the only Windows channel. Microsoft signs the app and the Store keeps it updated, and
winget install --id 9MZ3C28M65PB --source msstoreinstalls the same Store package.There is no Windows file on the Releases page. The portable zip published up to 0.8 is no longer built.
-
macOS: Apple Silicon, ad-hoc signed
Apple Silicon only, macOS 11 or later. Intel Macs are not published yet; building from source is one command.
The app is not notarized, so on first launch macOS says it cannot check the app for malicious software. On macOS 15 and later, close that dialog, then press Open Anyway next to kubeNimbus in System Settings > Privacy & Security. On macOS 14 and earlier, right-click the app, choose Open, then Open again. On any version,
xattr -dr com.apple.quarantine /Applications/kubeNimbus.appin a terminal does the same. After that it opens normally. -
Linux: AppImage, .deb or .tar.gz
x86_64 and aarch64, as an AppImage, a
.debor a plain.tar.gz. None of them is signed.The AppImage runs on glibc 2.35 or newer (Ubuntu 22.04, Debian 12, RHEL 9 and later) and can update through AppImageUpdate. The others are a new download for each release.
Why kubeNimbus
For SREs and platform teams who want to see what is wrong in a cluster, read why, and get to the logs, with nothing to install in the cluster and no account to make.
What needs attention, first
A cluster opens on Applications: every Argo CD Application and every workload Argo does not track, each with a health verdict and a one-line reason, such as Crash-looping (exit 1) · 2 pods not created: namespace quota
.
The reasons come from fixed rules that read the cluster's own status fields. Enter opens the evidence, the last hour on a timeline, and the crashing pod's last run.
Metrics without Prometheus
CPU and memory come from metrics.k8s.io, which metrics-server serves: columns on the pod and node lists, usage graphs over a rolling 30 minutes, and a capacity strip above the Nodes list.
A cluster without metrics-server loses those columns, not the list, and shows no error.
Argo CD and Helm, built in
A cluster running Argo CD gets a dashboard of its Applications, with sync status and health as two separate pills. Sync and Refresh from Git run on the click; Sync with prune and Terminate sync ask first.
Helm releases are read from their Secrets: values, rendered manifest, notes and history. No argocd or helm binary, and no second login.
Native, and quick to open
Compiled ahead of time with .NET NativeAOT: a self-contained app with no .NET runtime to install.
Lists are Kubernetes watches, so they change when the cluster does and reconnect on their own after a dropped connection. Logs stream as the lines arrive.
No telemetry
No analytics, no crash reporting and no update check. The only connections it makes are to the clusters you open, through the proxy a cluster's proxy-url names when it names one.
No account, no subscription, no seat limit. MIT licensed, commercial use included. Privacy policy.
Your kubeconfig, as it is
It reads every $KUBECONFIG entry and ~/.kube/config, runs exec plugins for EKS, GKE and AKS at connect time, and honours proxy-url. Tokens and certificates are never copied into app storage.
Production, staging and development each get a colour, and a red band stays under the command bar while you point at production.
See it in action
From the unhealthy app to its logs, and the tools around them.
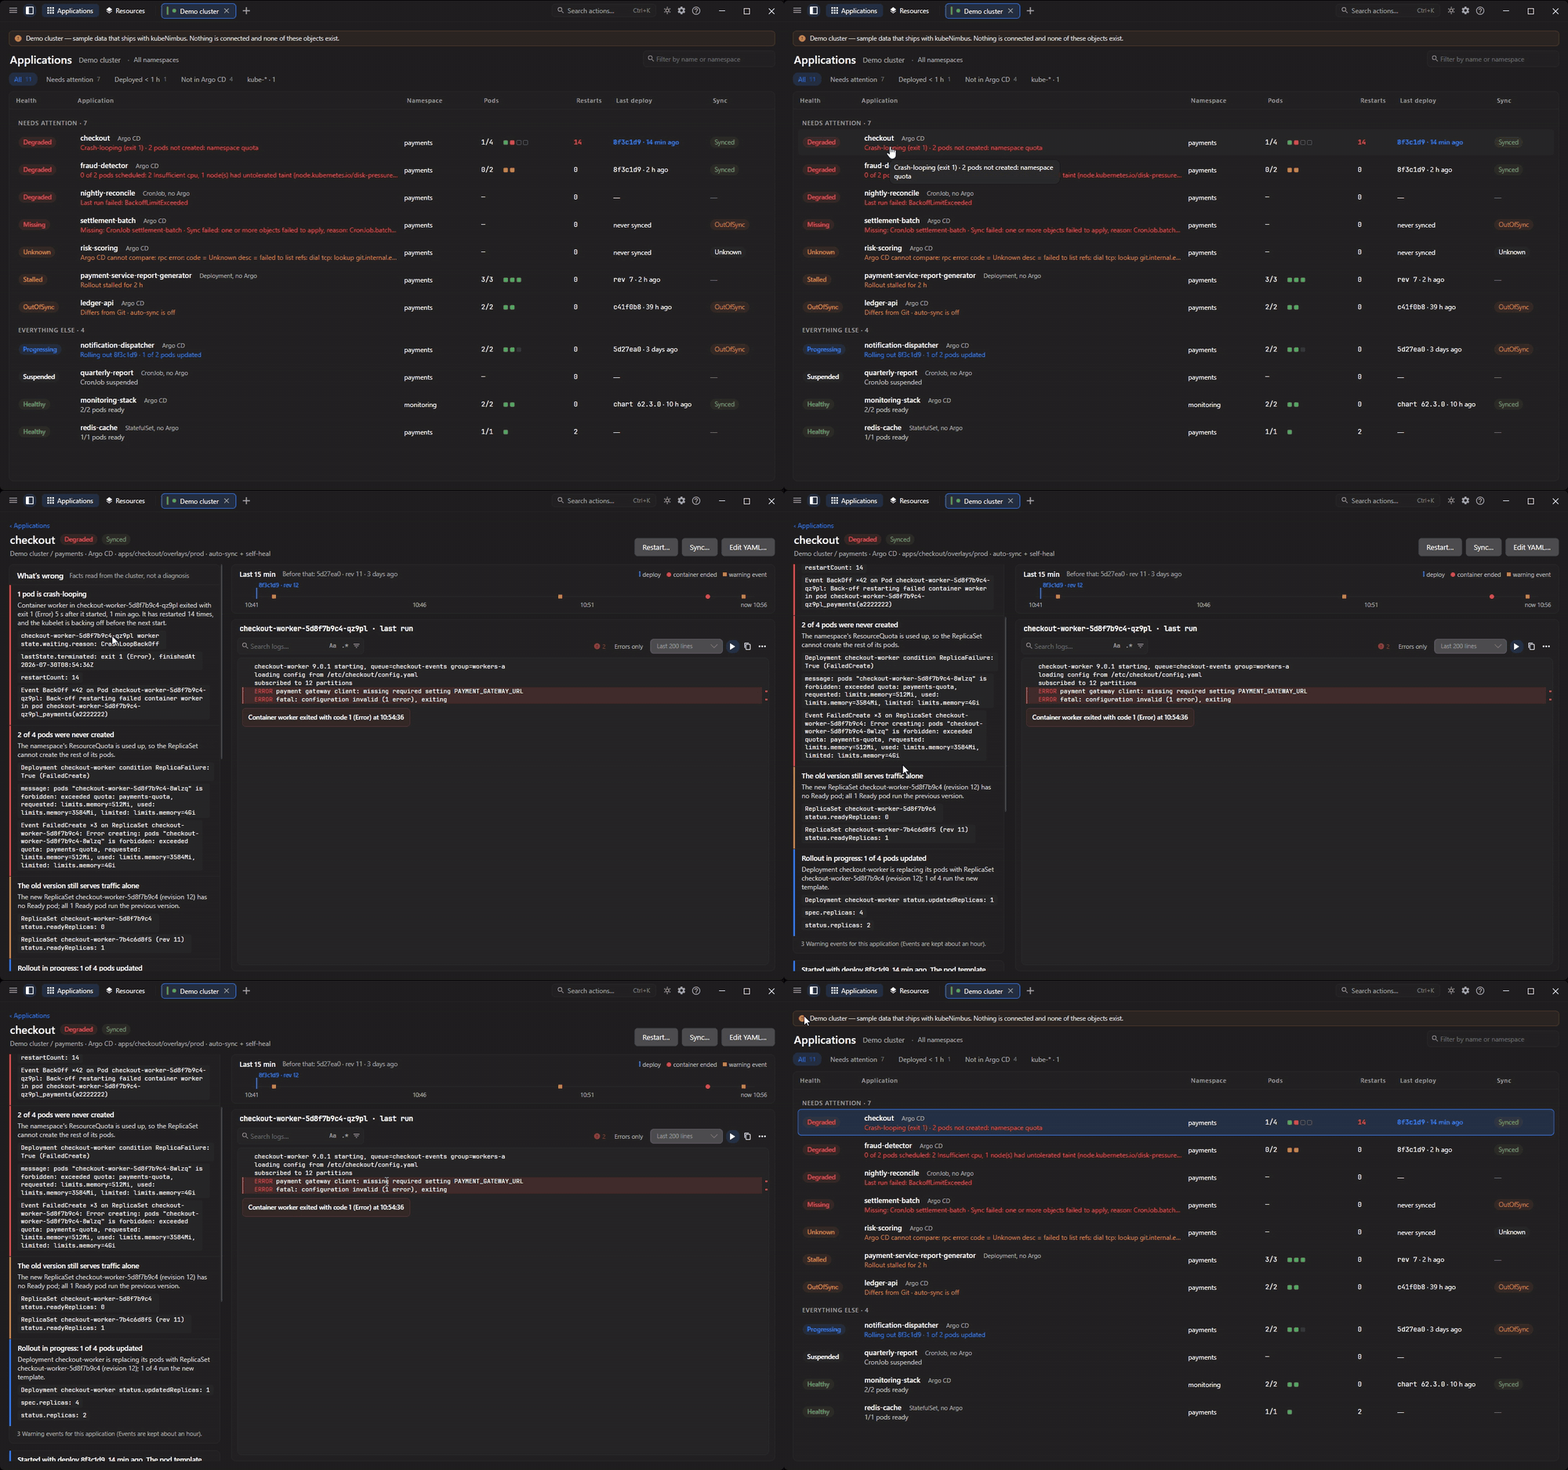
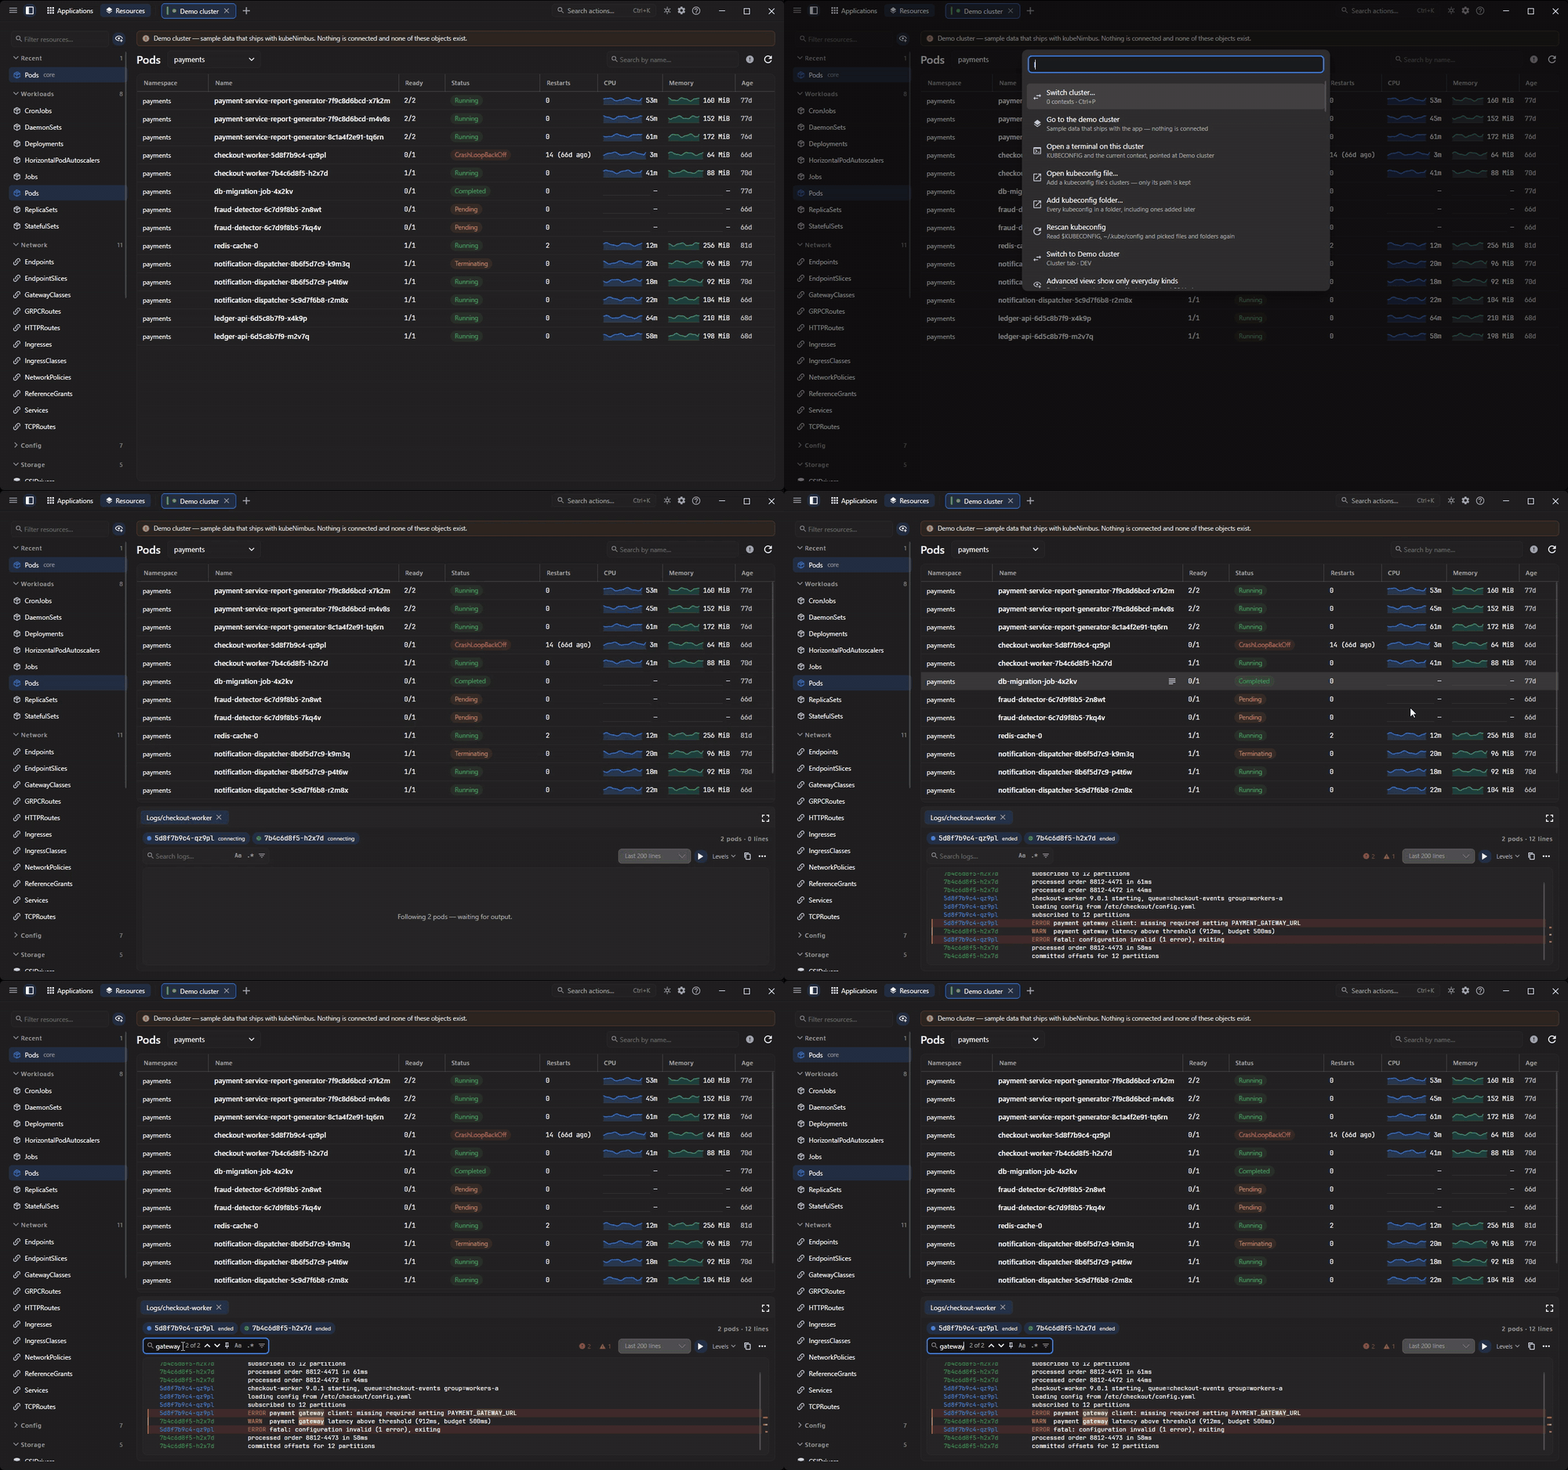
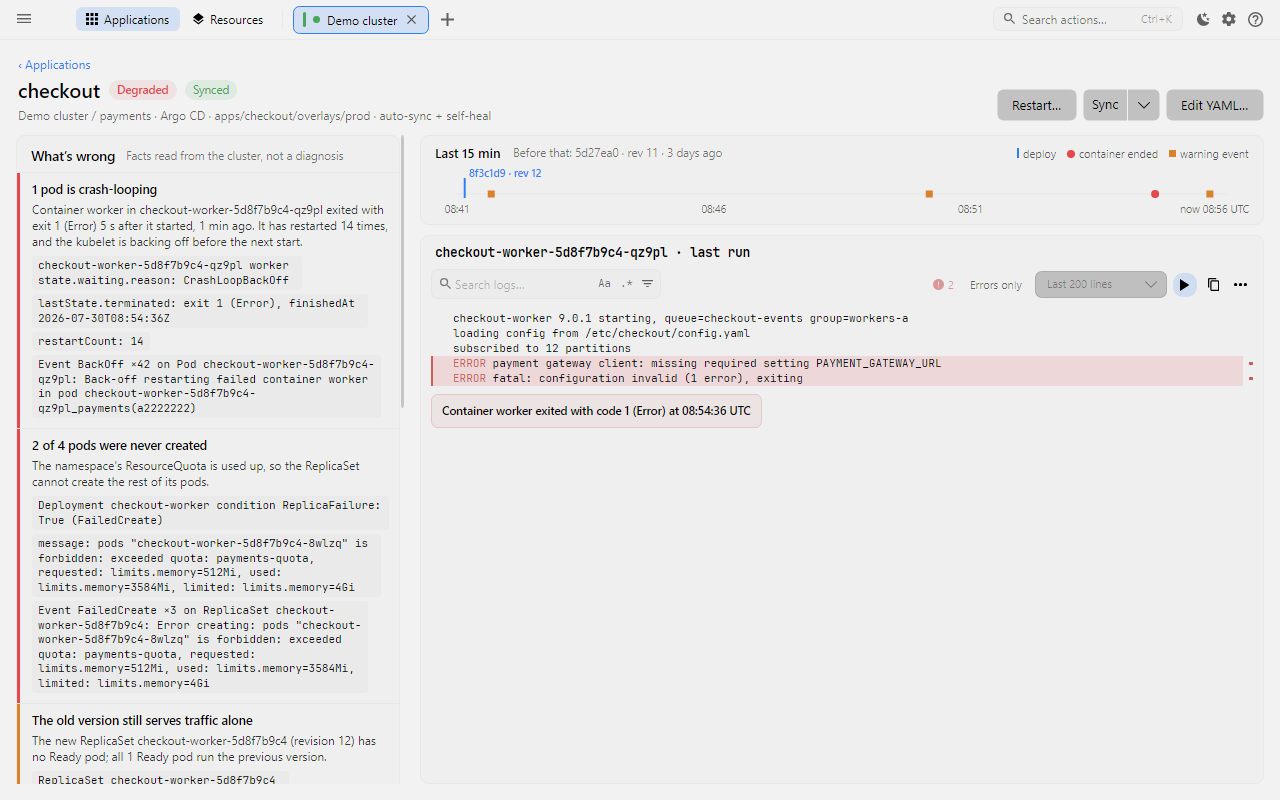
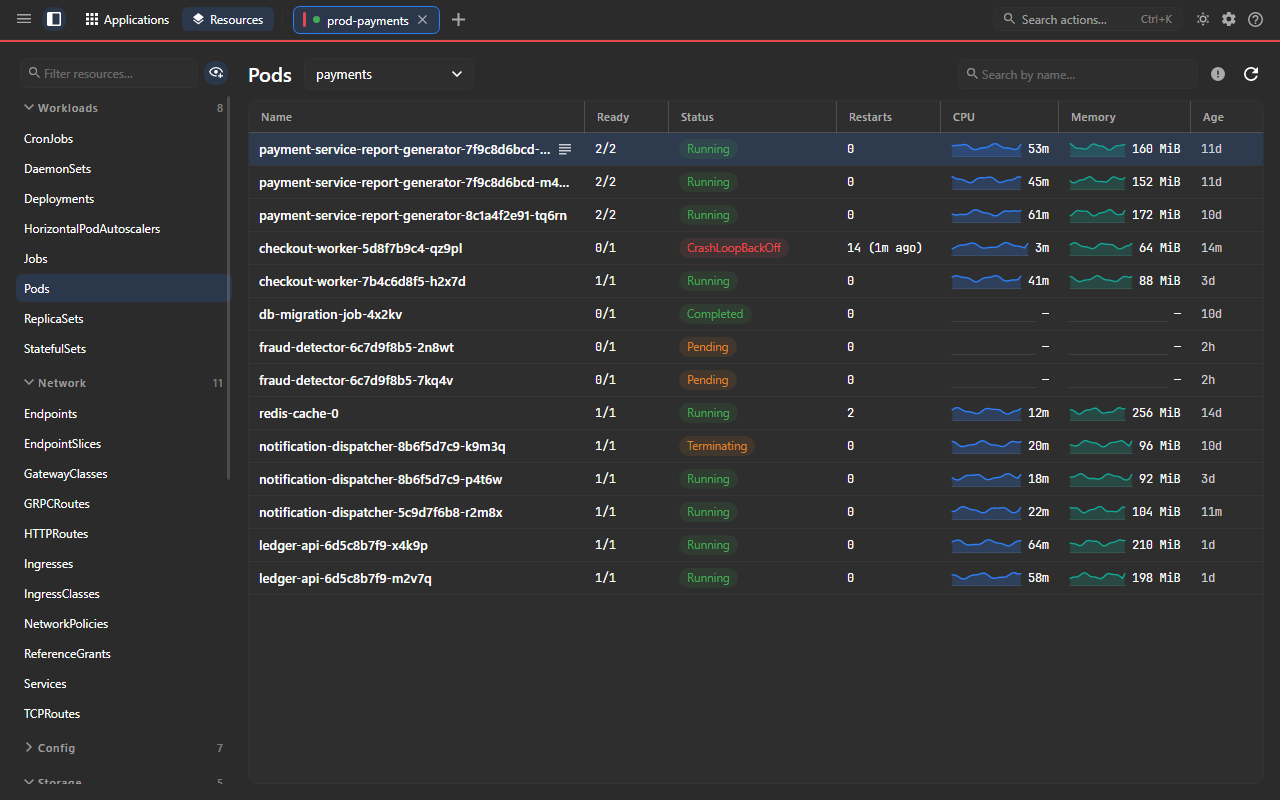
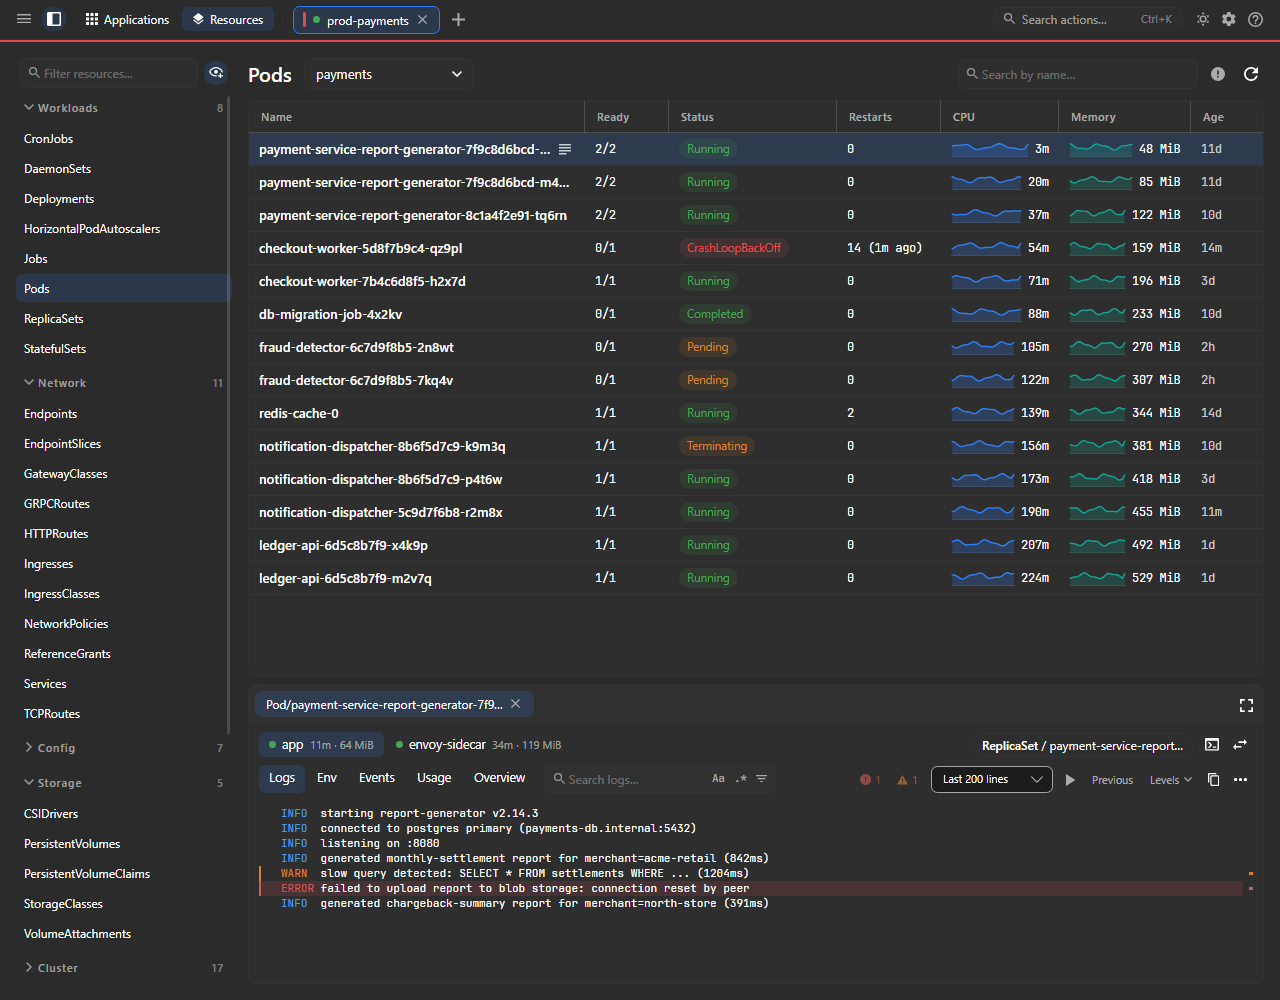
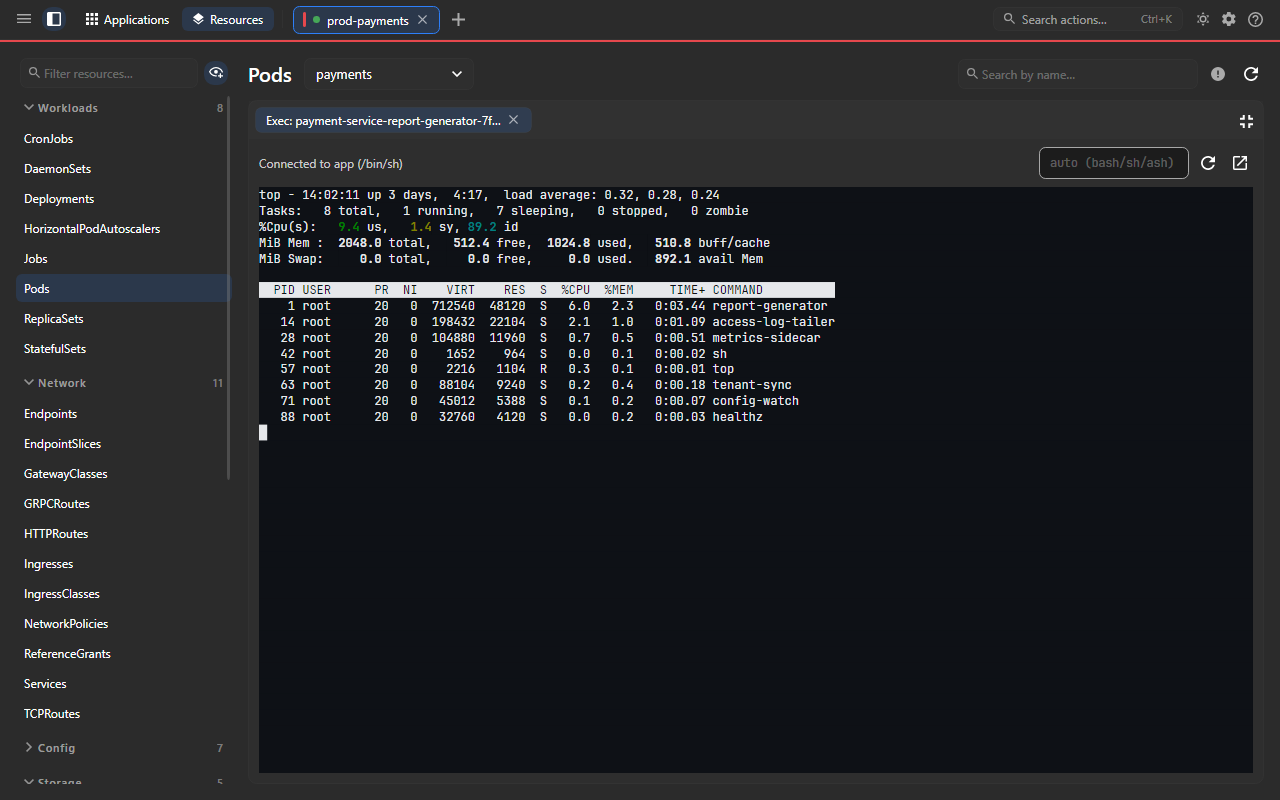
vi, top and mc draw, and Ctrl+C reaches the container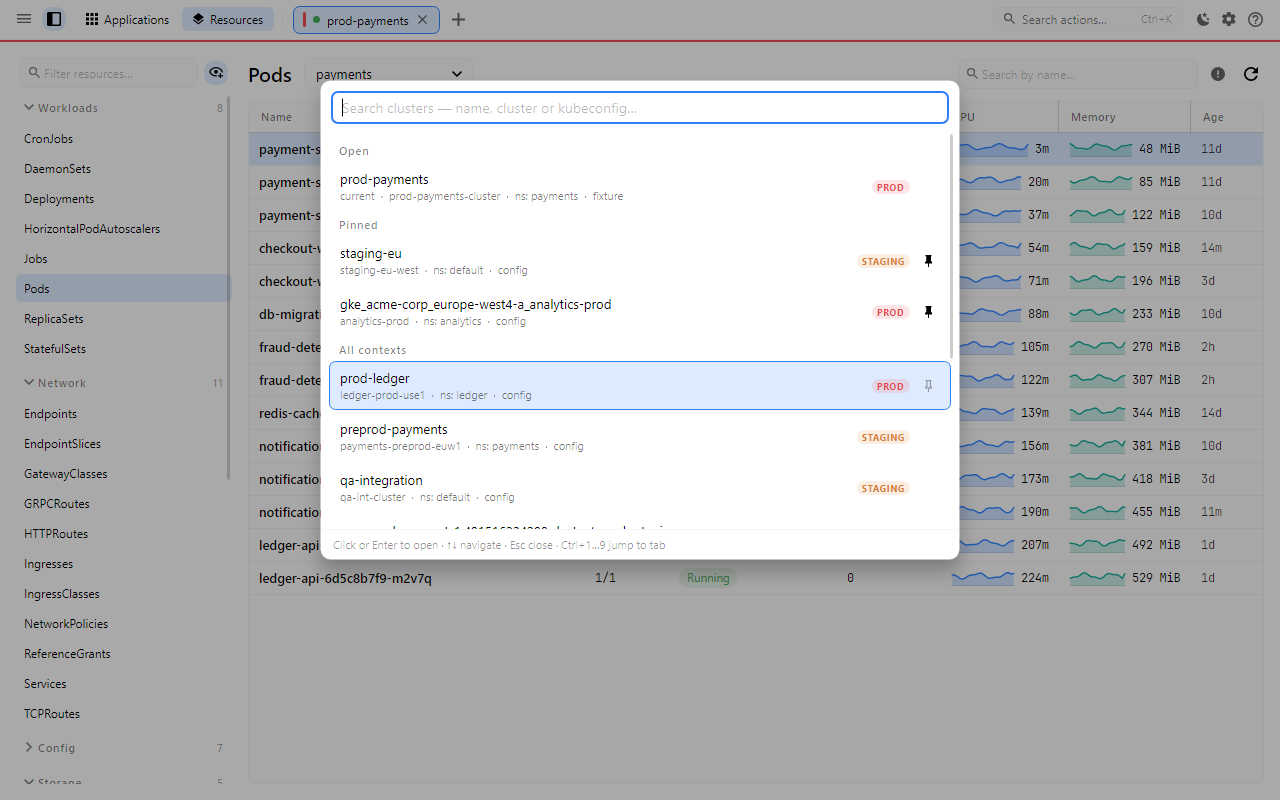
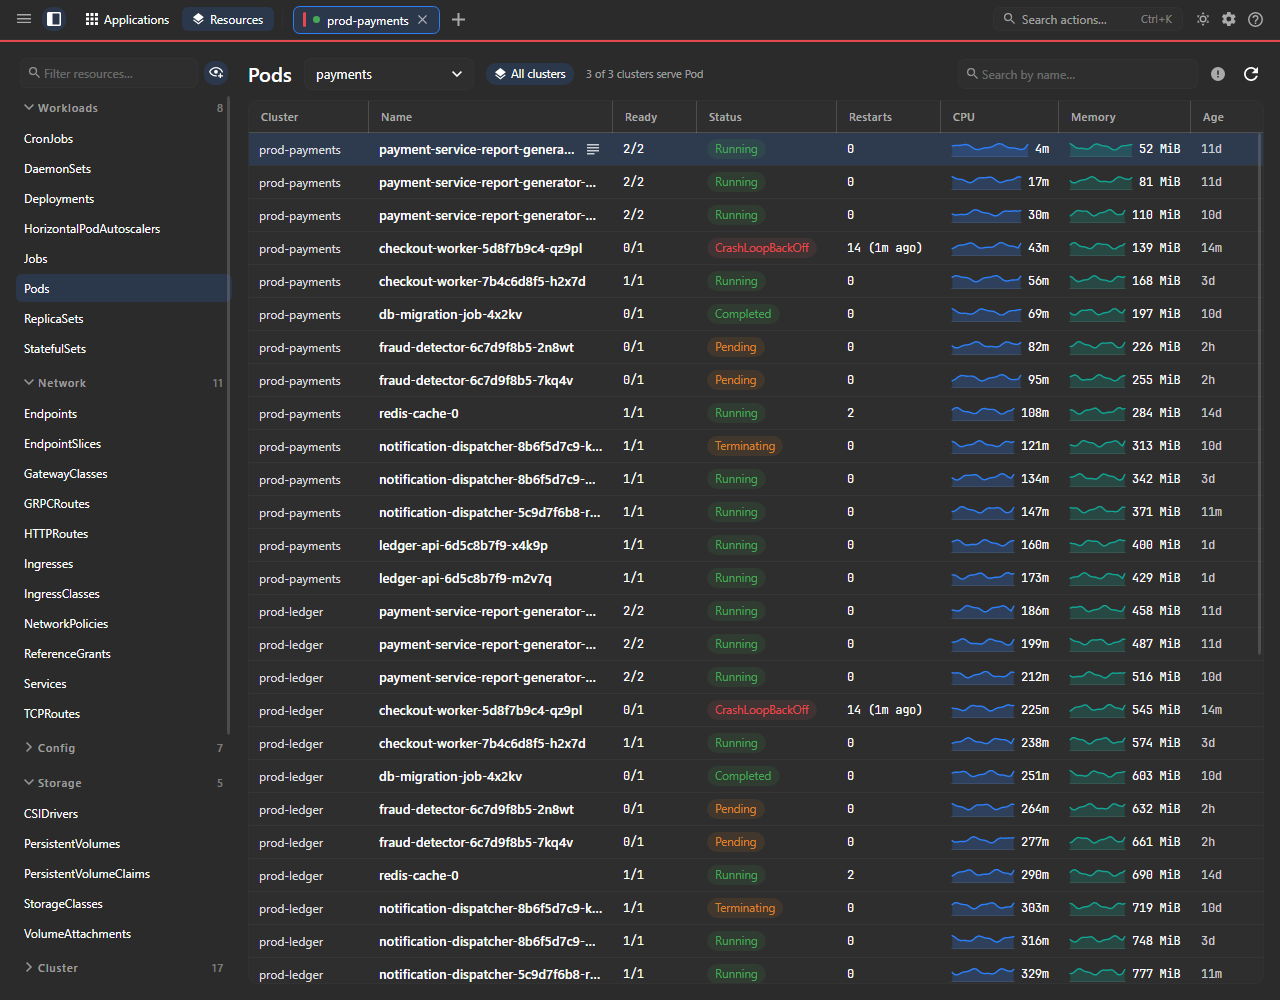
The stills come from the repository's headless screenshot harness: real views over sample data. The two recordings are the Windows app on the built-in demo cluster. No real cluster or credentials appear.
What it does
One window. Secondary actions live in the command palette (Ctrl/Cmd+K) and right-click menus, not on a toolbar.
- Connect. Every
$KUBECONFIGentry and~/.kube/config, exec-plugin sign-in, andproxy-urlover HTTP or SOCKS5 for a bastion. A failed connect says which step failed and why, with Retry; an expired session is picked up without closing the tab. - Triage. Applications puts what needs attention first, with a one-line reason per app. It works under narrow RBAC and says what it could not read.
- Browse. A sidebar built from API discovery, CRDs included, filtered by name, API group or
kubectlshort name (svc,po). Lists use list and watch, resume after a dropped connection, and relist on 410 Gone. - Logs. Follow, search, regular expressions, level filters, the previous container's logs for a CrashLoopBackOff, and all of a workload's pods merged into one stream.
- Exec and port-forward. A VT terminal where
vi,topandlesswork. An image with no shell gets a debug container in one click. Port-forward a pod or a service and open the local address. - Edit. YAML with syntax highlighting, a dry-run preview, and server-side apply through a field manager, with conflicts shown and a force-apply offered. New in 1.0: open a local YAML file.
- Act. Scale, rollout restart, cordon, drain and delete. New in 1.0: restart several workloads with one confirmation. A restart, a drain or a delete is armed and named before it fires, and a delete on a production cluster always asks.
- Measure. CPU and memory from metrics-server in the lists and per container, a 30-minute rolling graph, node allocatable against requested, and a capacity strip over the Nodes list.
- Argo CD. Applications, ApplicationSets and AppProjects, read and written as Argo's own custom resources over your Kubernetes connection. Sync, refresh, prune and terminate a running sync.
- Helm. Releases with values, rendered manifest, notes and revision history, read straight from release Secrets. Read-only.
- RBAC. Your own permissions (a
SelfSubjectRulesReview), where a ServiceAccount's access comes from, and who can do X, with a one-clickSubjectAccessReviewto confirm an answer. - Many clusters. Tabs restored with your workspace, a Ctrl/Cmd+P switcher with fuzzy search and pins, and an All clusters list across every connected cluster.
- Keyboard. A Ctrl/Cmd+K command palette, F1 for every shortcut, and light and dark themes.
- Demo cluster. Explore demo cluster opens sample data that ships inside the app, labelled as such, with no cluster, credentials or network involved.
What it does not do
- Install, upgrade or roll back Helm charts. Helm support is read-only; that stays Helm's job.
- Keep long-range metrics. Usage history is capped at 30 minutes by design; long-range metrics are Prometheus's job.
- Complete YAML from a schema. The editor highlights and validates through a dry run, but has no schema-aware completion.
- Open more than one window, or provision clusters, run an in-cluster agent, or send telemetry. Those last three are permanent non-goals.
Numbers, with their dates
Each one says what was measured, on what, and when.
.tar.gz, with nothing else to installThe startup figure was taken on 11 October 2026 with scripts/measure-startup.ps1 on an AMD Ryzen 9 5900X, from build f9b118f, which shipped in 0.7.0. The script measures any published build, and CI runs it on every pull request that can change startup.
It was not re-run with that script for 1.0. The 1.0.0 release check timed something different, the whole --smoke-test run from launch to exit: a median of 524 ms over seven runs, against 530 ms for 0.8.0 on the same machine.
How kubeNimbus compares with Lens, FreeLens, KubeUI, Aptakube, Headlamp and k9s on startup, footprint, telemetry and metrics is on its own page, with a source and a date beside every number, and the places other clients are ahead said plainly.
Download
Self-contained NativeAOT builds: no .NET runtime to install. Every package is launched by CI on its own platform before the release is created.
Windows (x64)
Install from the Microsoft Store. Microsoft signs the app and the Store keeps it updated.
Microsoft StoreOr from a terminal, which installs the same Store package:
winget install --id 9MZ3C28M65PB --source msstore
There is no Windows download on the Releases page. If you used the portable zip (published up to 0.8), delete its folder once the Store app is installed.
macOS (Apple Silicon)
A .dmg for macOS 11 or later. Open it and drag kubeNimbus to Applications. The app is signed ad-hoc and not notarized, so macOS blocks the first launch. Open it once and close the dialog, then:
System Settings → Privacy & Security → Open Anyway
That is macOS 15 and later. On macOS 14 and earlier, right-click the app and choose Open, then Open again. On any version, xattr -dr com.apple.quarantine /Applications/kubeNimbus.app in a terminal clears the block. After the first launch it opens normally. The .tar.gz is the same binary for a terminal: run xattr -dr com.apple.quarantine . in its folder first. Intel Macs are not published yet; build from source.
Linux (x86_64 and aarch64)
The AppImage runs on any distribution with glibc 2.35 or newer (Ubuntu 22.04, Debian 12, RHEL 9 and later). Make it executable and launch it:
chmod +x kubeNimbus-*.AppImage
A Debian and Ubuntu .deb, which pulls in the libraries it needs and adds a launcher, and a plain .tar.gz are on the same page. All of them need a desktop session (X11, or Wayland through XWayland).
Every release ships SHA256SUMS.txt, and gh release verify-asset and gh attestation verify check a file against GitHub's own records. How to verify a download.
Tell us how it went
kubeNimbus is new, and reports from real clusters are what it needs most. A bug report, a feature request, or a note that it worked on your setup all help.
It is free and MIT licensed. If it saves you time at work, you can support the work with a coffee.

From the same family: pgNimbus is the same idea for PostgreSQL, a native client that talks to your database and nothing else. Both apps are built on one shared UI layer, nimbusUi, so they look and behave alike.